Example: Gas Release due to Cavitation Within a Resistor
The performance of the enhanced DSHplus components for modeling cavitation effects in resistors is demonstrated using an example simulation.
The flow rate limitation due to vapour cavitation and the subsequent release of gas is analysed by a simple simulation set-up consisting of three pipes and a resistor.
The adjacent video shows the content of this page as a webinar.
Simulation Set-Up
Three pipe elements, a resistor element, a connecting element and two line terminations are used to represent the hydraulic system (red box in the adjacent picture).
At the “open ends” of pipe 1 and pipe 3, pressures (pInlet and pOutlet) are prescribed to the system.
Since the pressures may vary with time, signal generating components (orange boxes) are used.
In order to visualise the distribution of flow quantities like pressure or velocity along the pipe network, specialised plotting components are used (green box).
The fluid properties are provided by a fluid property component (blue box). The liquid's vapour pressure pv equals 8.61 bar (absolute).
In order to demonstrate how the occurrence of cavitation as well as the gas release and absorption are influenced by the pressure level of the experiment, different parameter sets are evaluated.

Parameter Sets
At the beginning of the simulation, the pressures at the system inlet and outlet are identical (40 bar) and the gas-free liquid is at rest.
After a short time, a pressure difference of 5 bar between the inlet and outlet pressure is created:
- For parameter set "A", this is achieved by raising the inlet pressure to 45 bar while keeping the outlet pressure at 40 bar (upper diagram in the adjacent figure)
- For parameter set "B", this is achieved by keeping the inlet pressure at 40 bar while lowering the outlet pressure to 35 bar (lower diagram)
Due to the pressure difference, a flow from inlet to outlet is initiated and the pipe is slowly filled with the gas-carrying liquid (αG0 = 2.0 %).
Since all pressures are larger than the pressure pα = 0.2 bar (relative pressure) for which αG(p) = 0 %, the gas is entirely dissolved in the liquid, i.e. there are no gas bubbles.
After a steady state is reached, the pressure difference is increased further to 30 bar.
- For parameter set "A", this is achieved by raising the inlet pressure to 70 bar while keeping the outlet pressure at 40 bar (upper diagram in the adjacent figure)
- For parameter set "B", this is achieved by keeping the inlet pressure at 40 bar while lowering the outlet pressure to 10 bar (lower diagram). This pressure is very close to the vapour pressure of the liquid!
The pressure drops across the system are always identical for both parameter sets!
Can we also expect an identical discharge behaviour for both parameter sets?

Results for Parameter Set "A" (40 bar to 70 bar)
Top diagrams (left):
- Current values of pressures prescribed at first and last pipe
Center diagrams (left):
- Current values of flow rate & cavitation index
- Flow rate increases continuously with growing pressure difference since vapour cavitation does not occur (cavitation index C > Ccrit = 2.0)
Bottom diagrams (left):
- Current values of undissolved gas fractions
- No undissolved gas αG(p) anywhere since p > pα everywhere
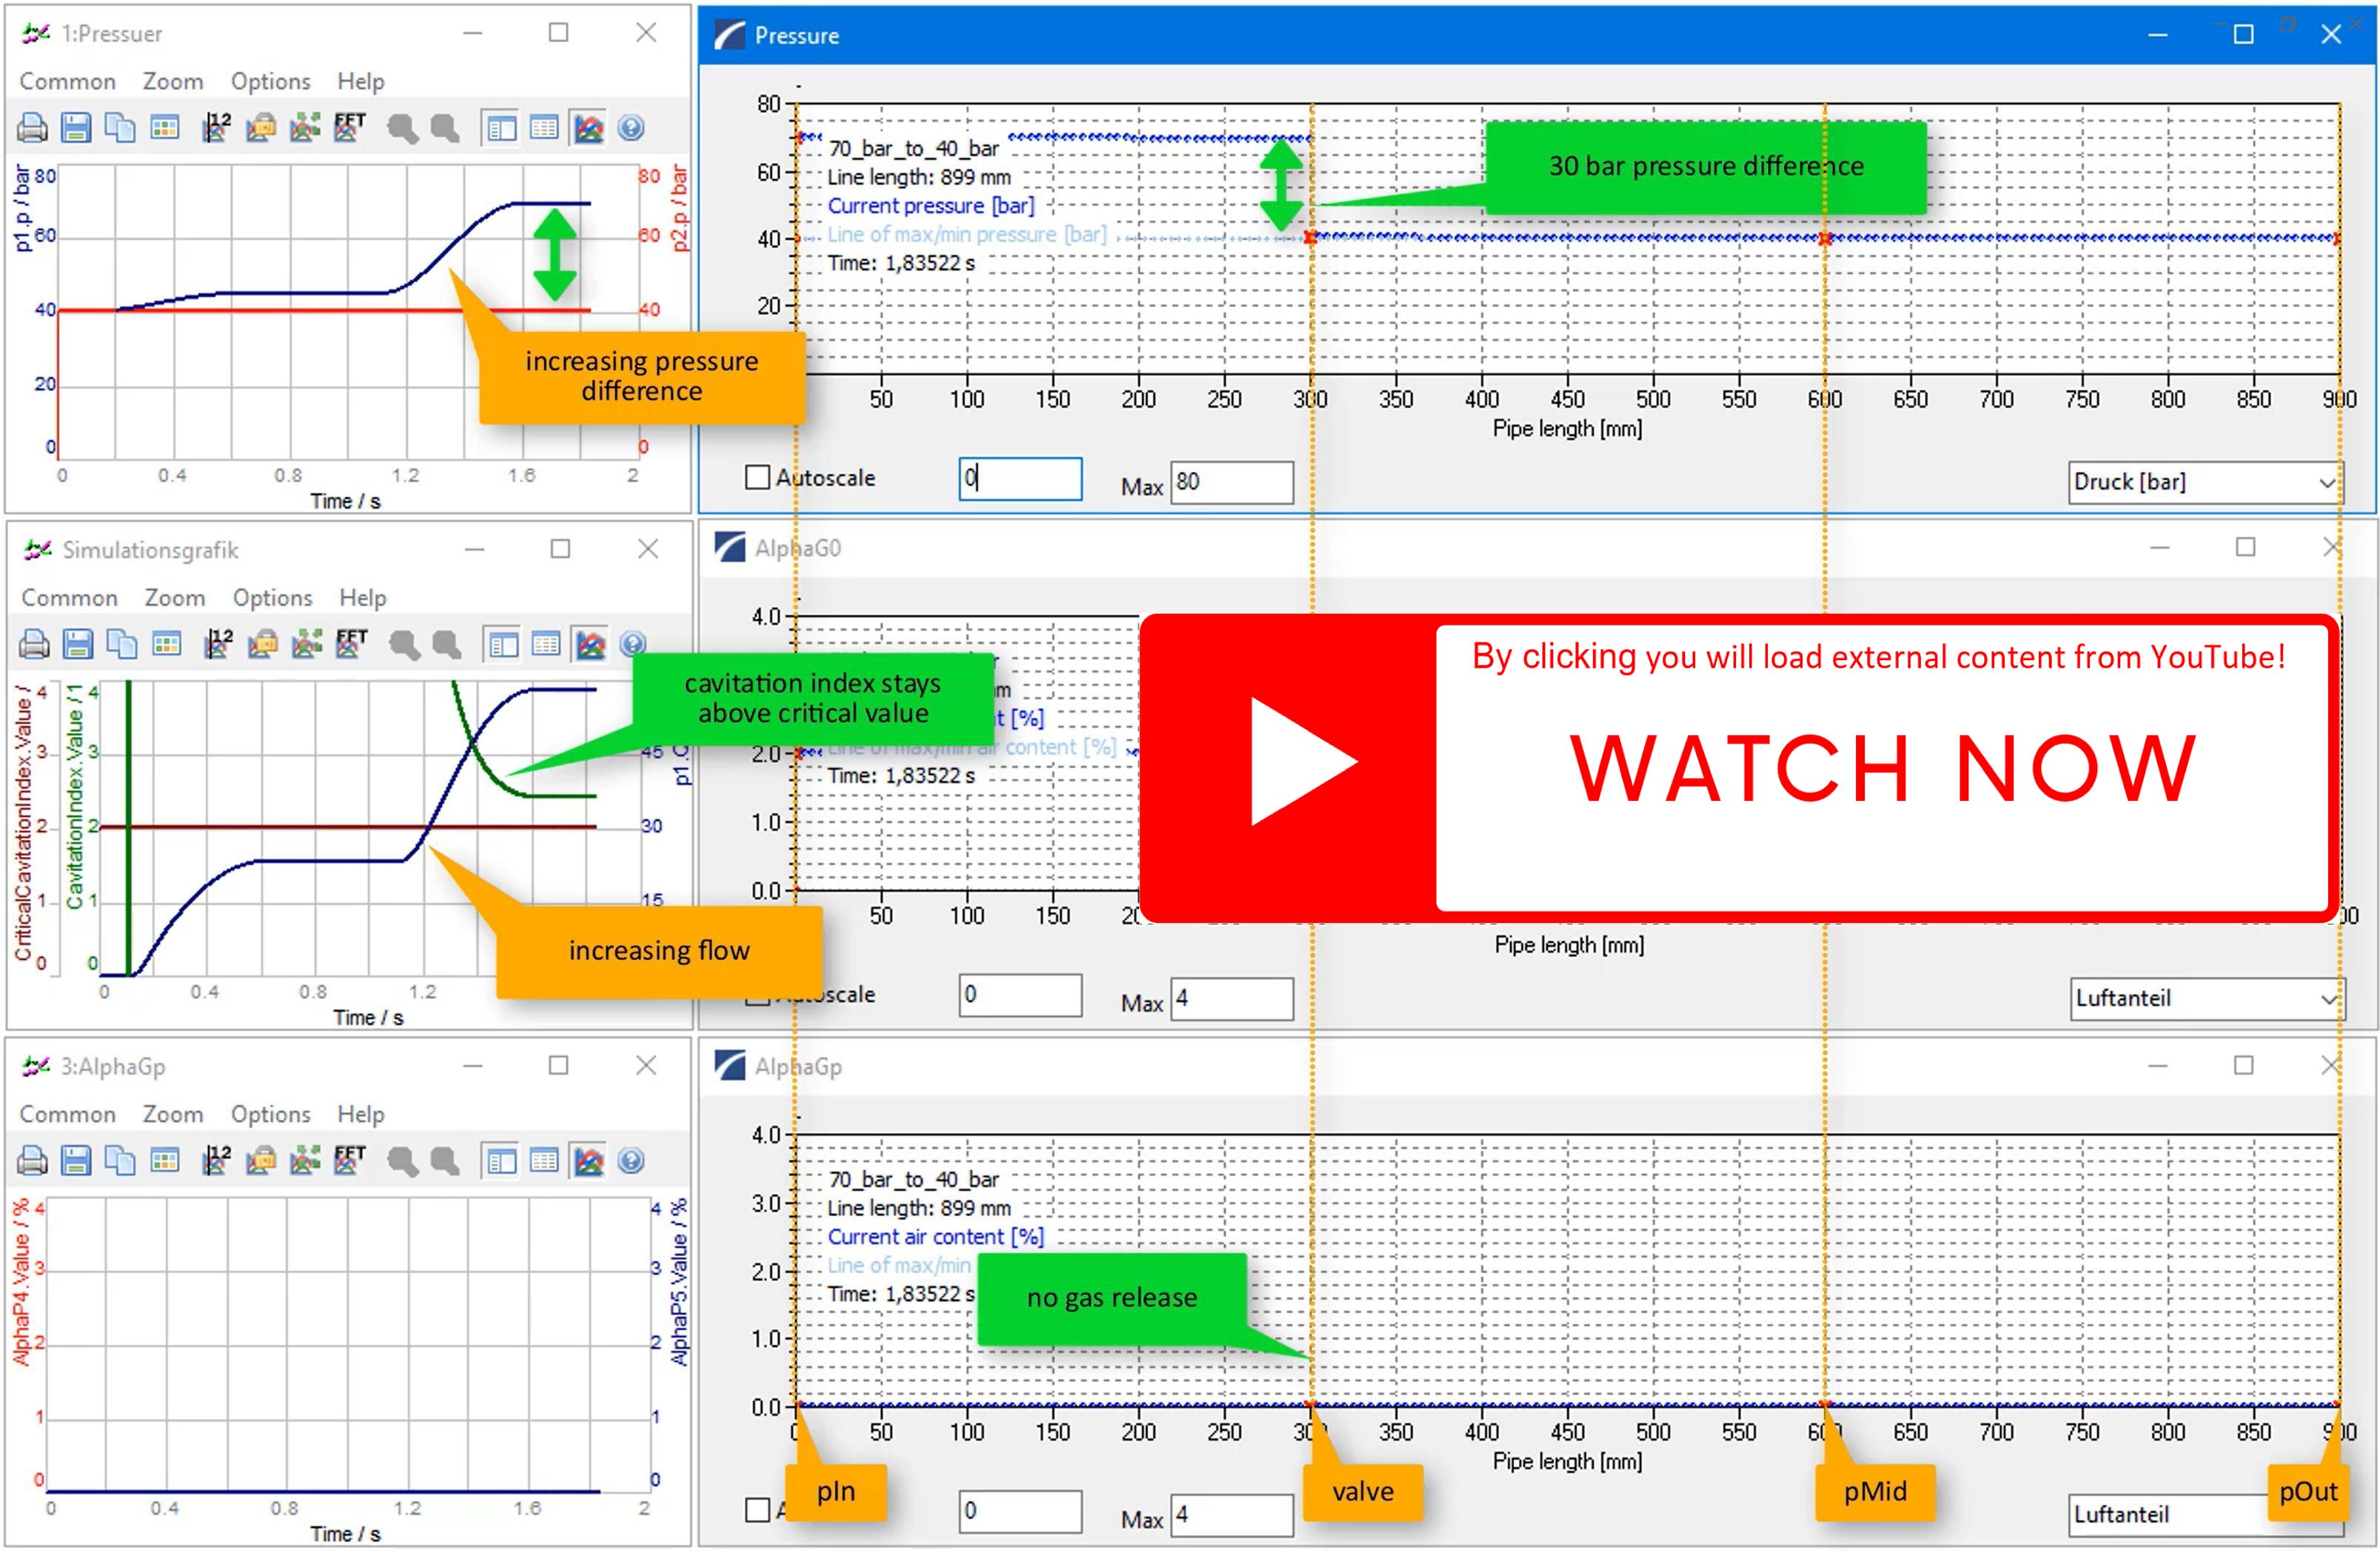
Top diagrams (right):
- Pressure distribution along the pipe network
- Prominent pressure drop @ resistor
Center diagrams (right):
- Distribution of gas fractions along the pipe network
Bottom diagrams (right):
- Distribution of undissolved gas fractions along the pipe network
- No gas release at resistor
Results for Parameter Set "B" (40 bar to 10 bar)
Top diagrams (left):
- Current values of pressures prescribed at inlet and outlet
Center diagrams (left):
- Current values of flow rate & cavitation index
- Initially, flow rate increases with increasing pressure difference
- After further increase, cavitation index C drops below Ccrit
- Onset of vapour cavitation
- Limitation of low rate (choking)
Bottom diagrams (left):
- Current values of undissolved gas fractions at inlet and outlet
- No undissolved gas at outlet
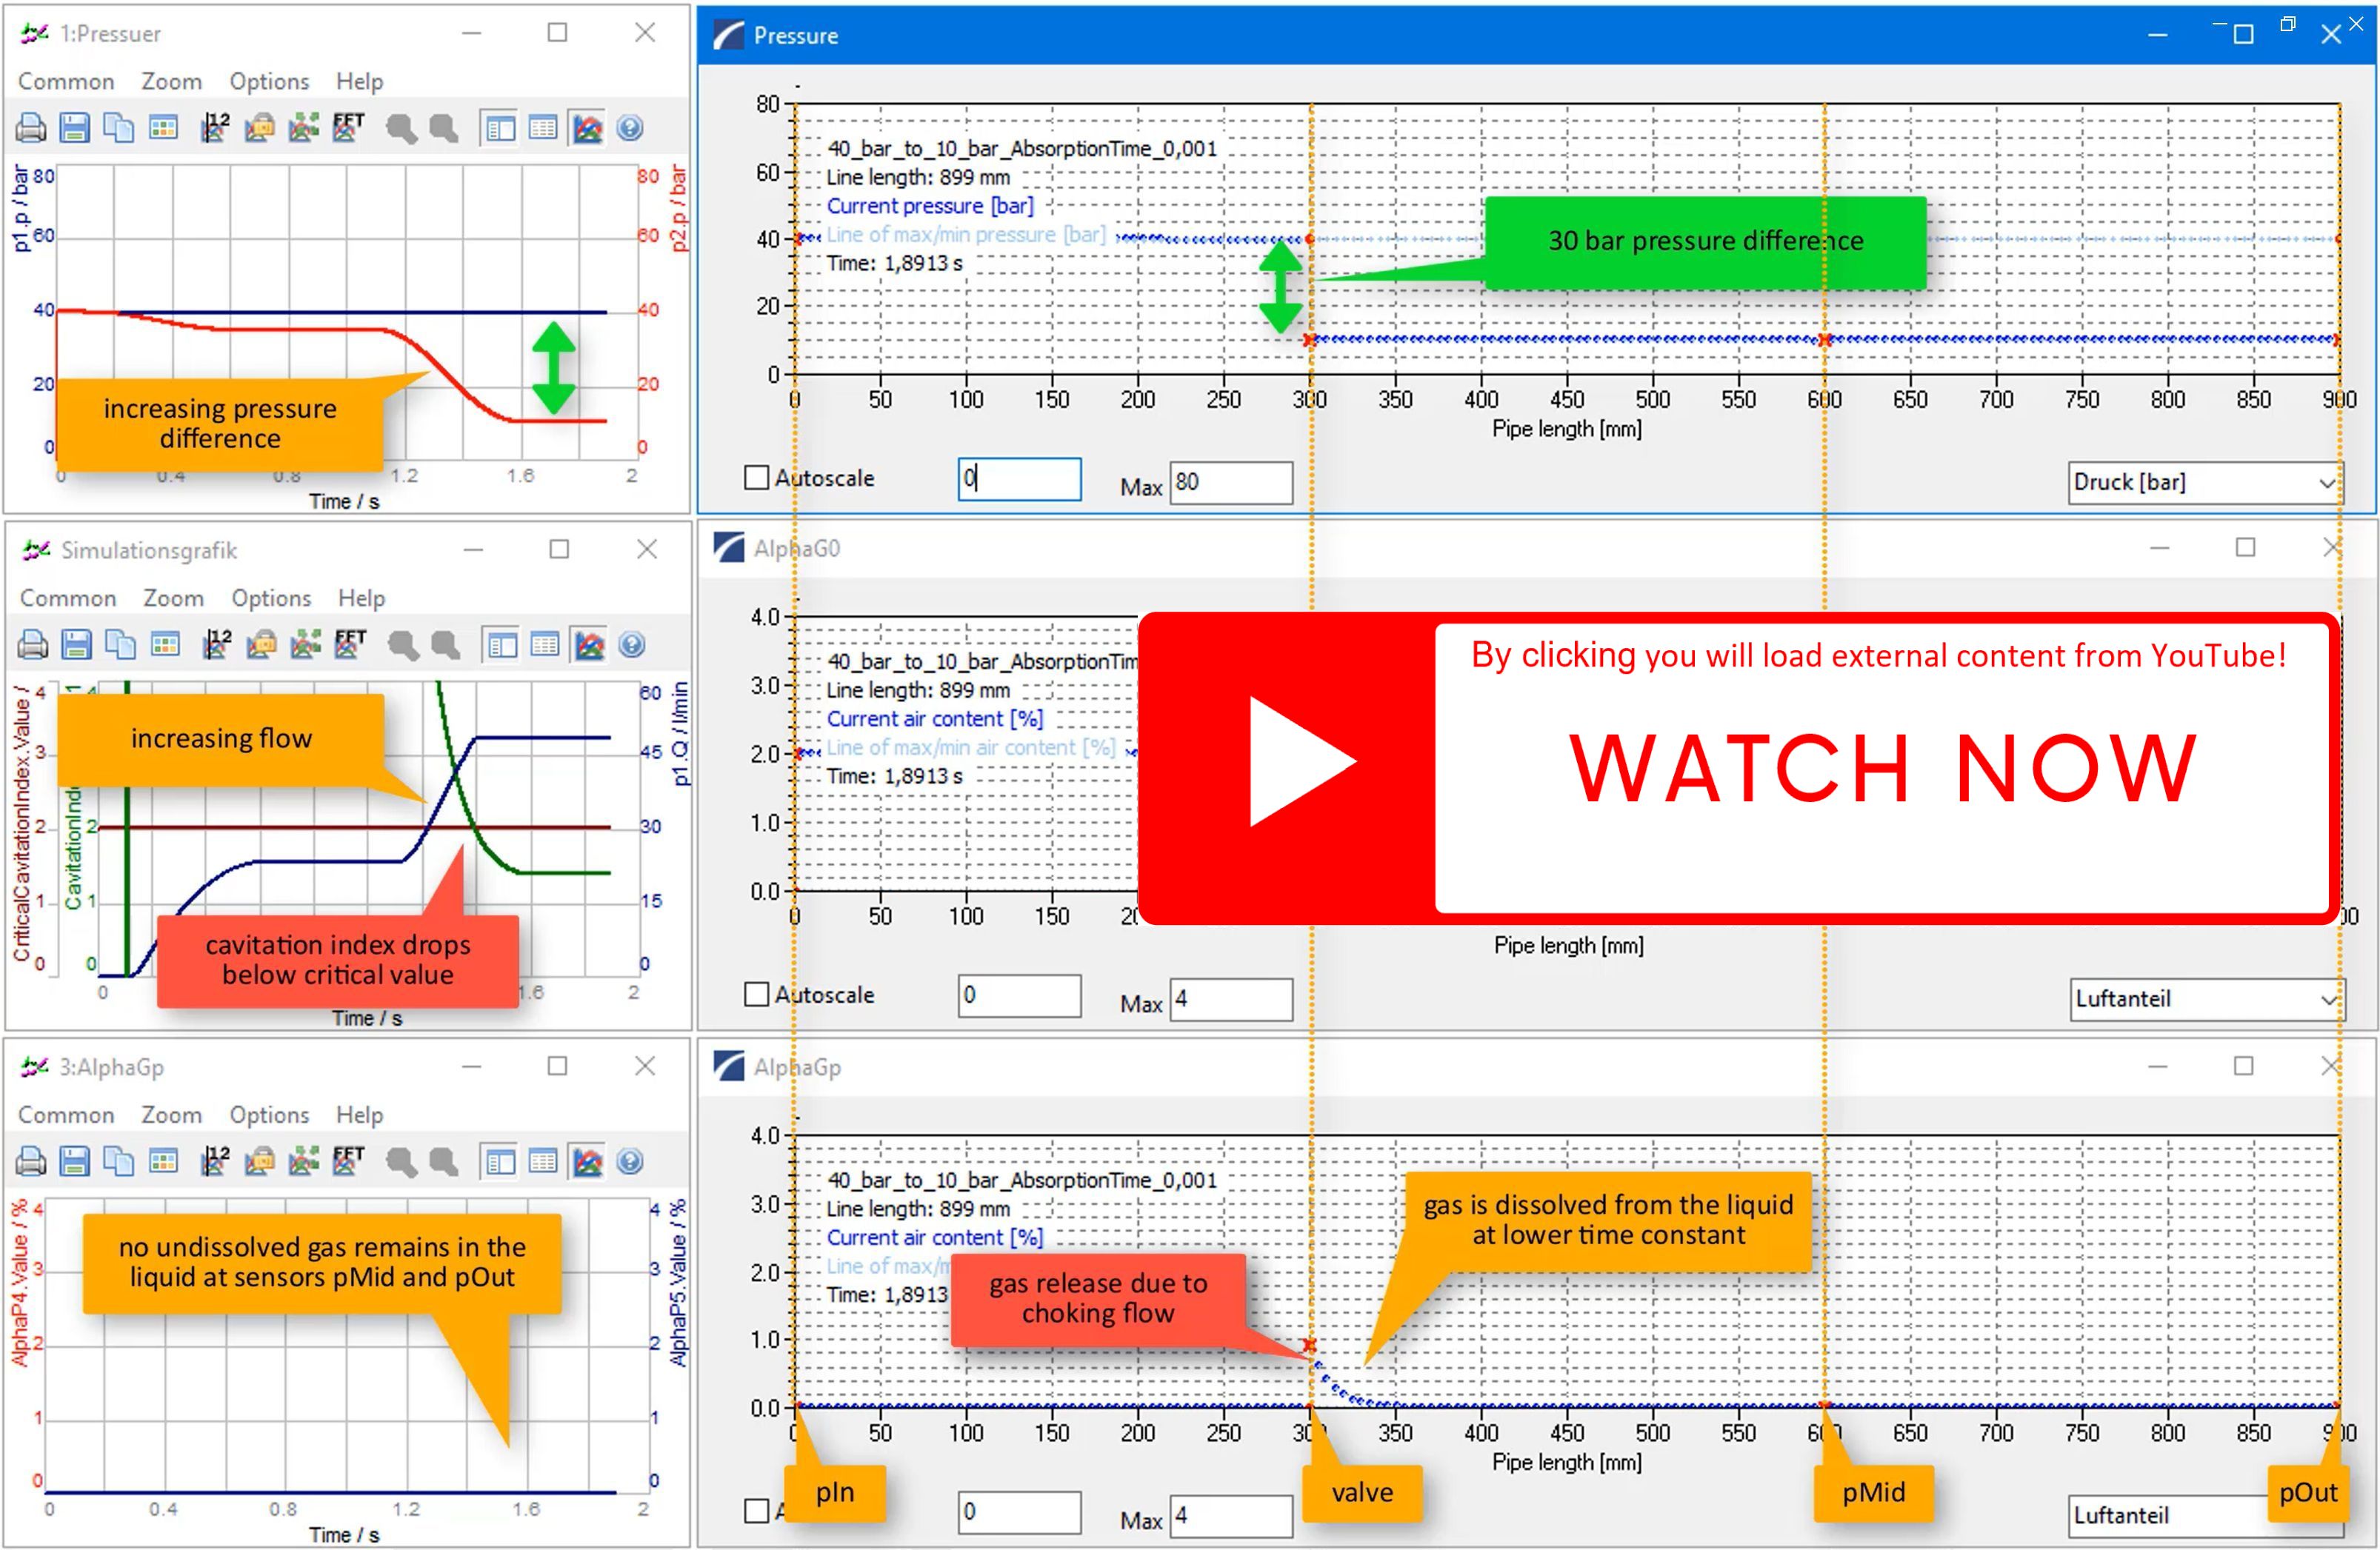
Top diagrams (right):
- Pressure distribution along the pipe network
- Prominent pressure drop @ resistor
Center diagrams (right):
- Distribution of gas fractions along the pipe network
Bottom diagrams (right):
- Distributions of undissolved gas fractions along the pipe network
- Gas release at resistor
- Due to a small absorption time constant τAbs, the gas remains undissolved for longer!
Results for modified Parameter Set "B" (40 bar to 10 bar)
This parameter set is based on parameter set "B". To demonstrate the impact of finite gas absorption rates, the time constant for absorption is increased by a factor of 10.
Top diagrams (left):
- Current values of pressures prescribed at first and last pipe
Center diagrams (left):
- Current values of flow rate & cavitation index
- Initially, flow rate increases with increasing pressure difference
- After further increase, cavitation index C drops below Ccrit
- Onset of vapour cavitation
- Limitation of flow rate (choking)
Bottom diagrams (left):
- Current values of undissolved gas fractions at inlet and outlet
- Undissolved gas at outlet due to larger absorption time constant!
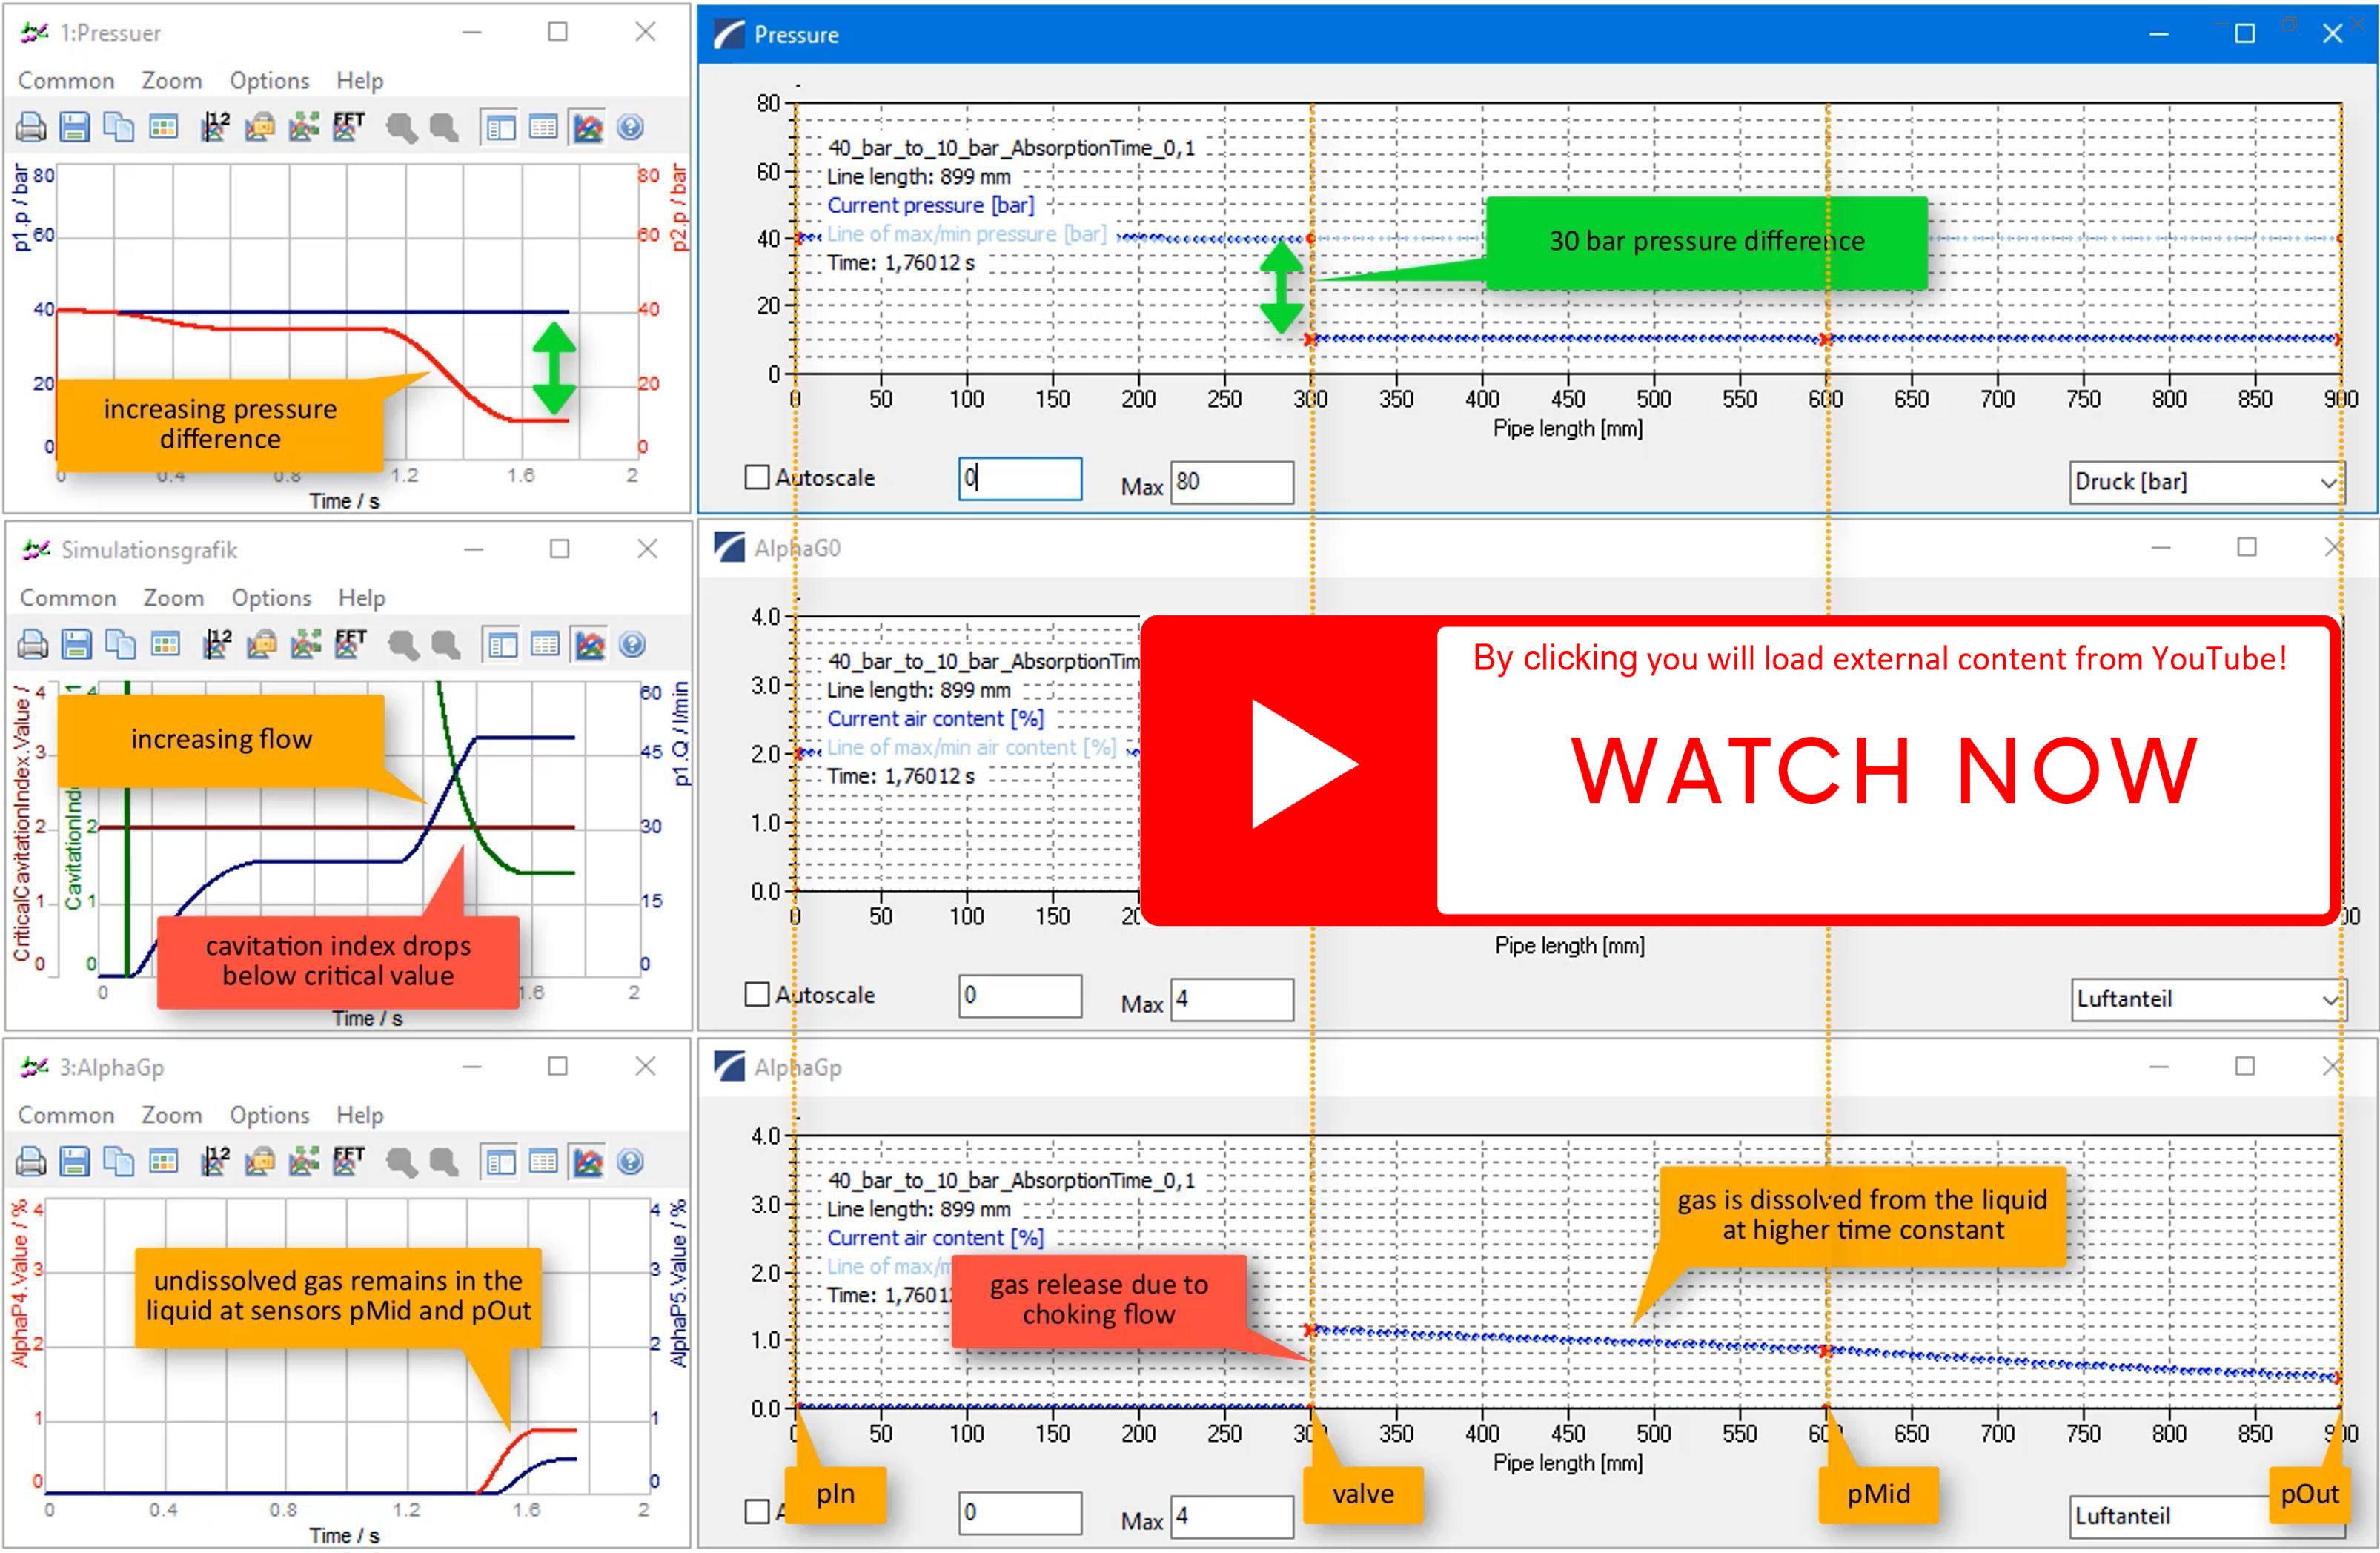
Top diagrams (right):
- Pressure distribution along the pipe network
- Prominent pressure drop @ resistor
Center diagrams (right):
- Distribution of gas fractions along the pipe network
Bottom diagrams (right):
- Distribution of undissolved gas fractions along the pipe network
- Gas release at resistor
- Due to a larger absorption time constant τAbs, the gas remains undissolved for longer and can potentially travel further downstream!
Analysis of discharge behaviour
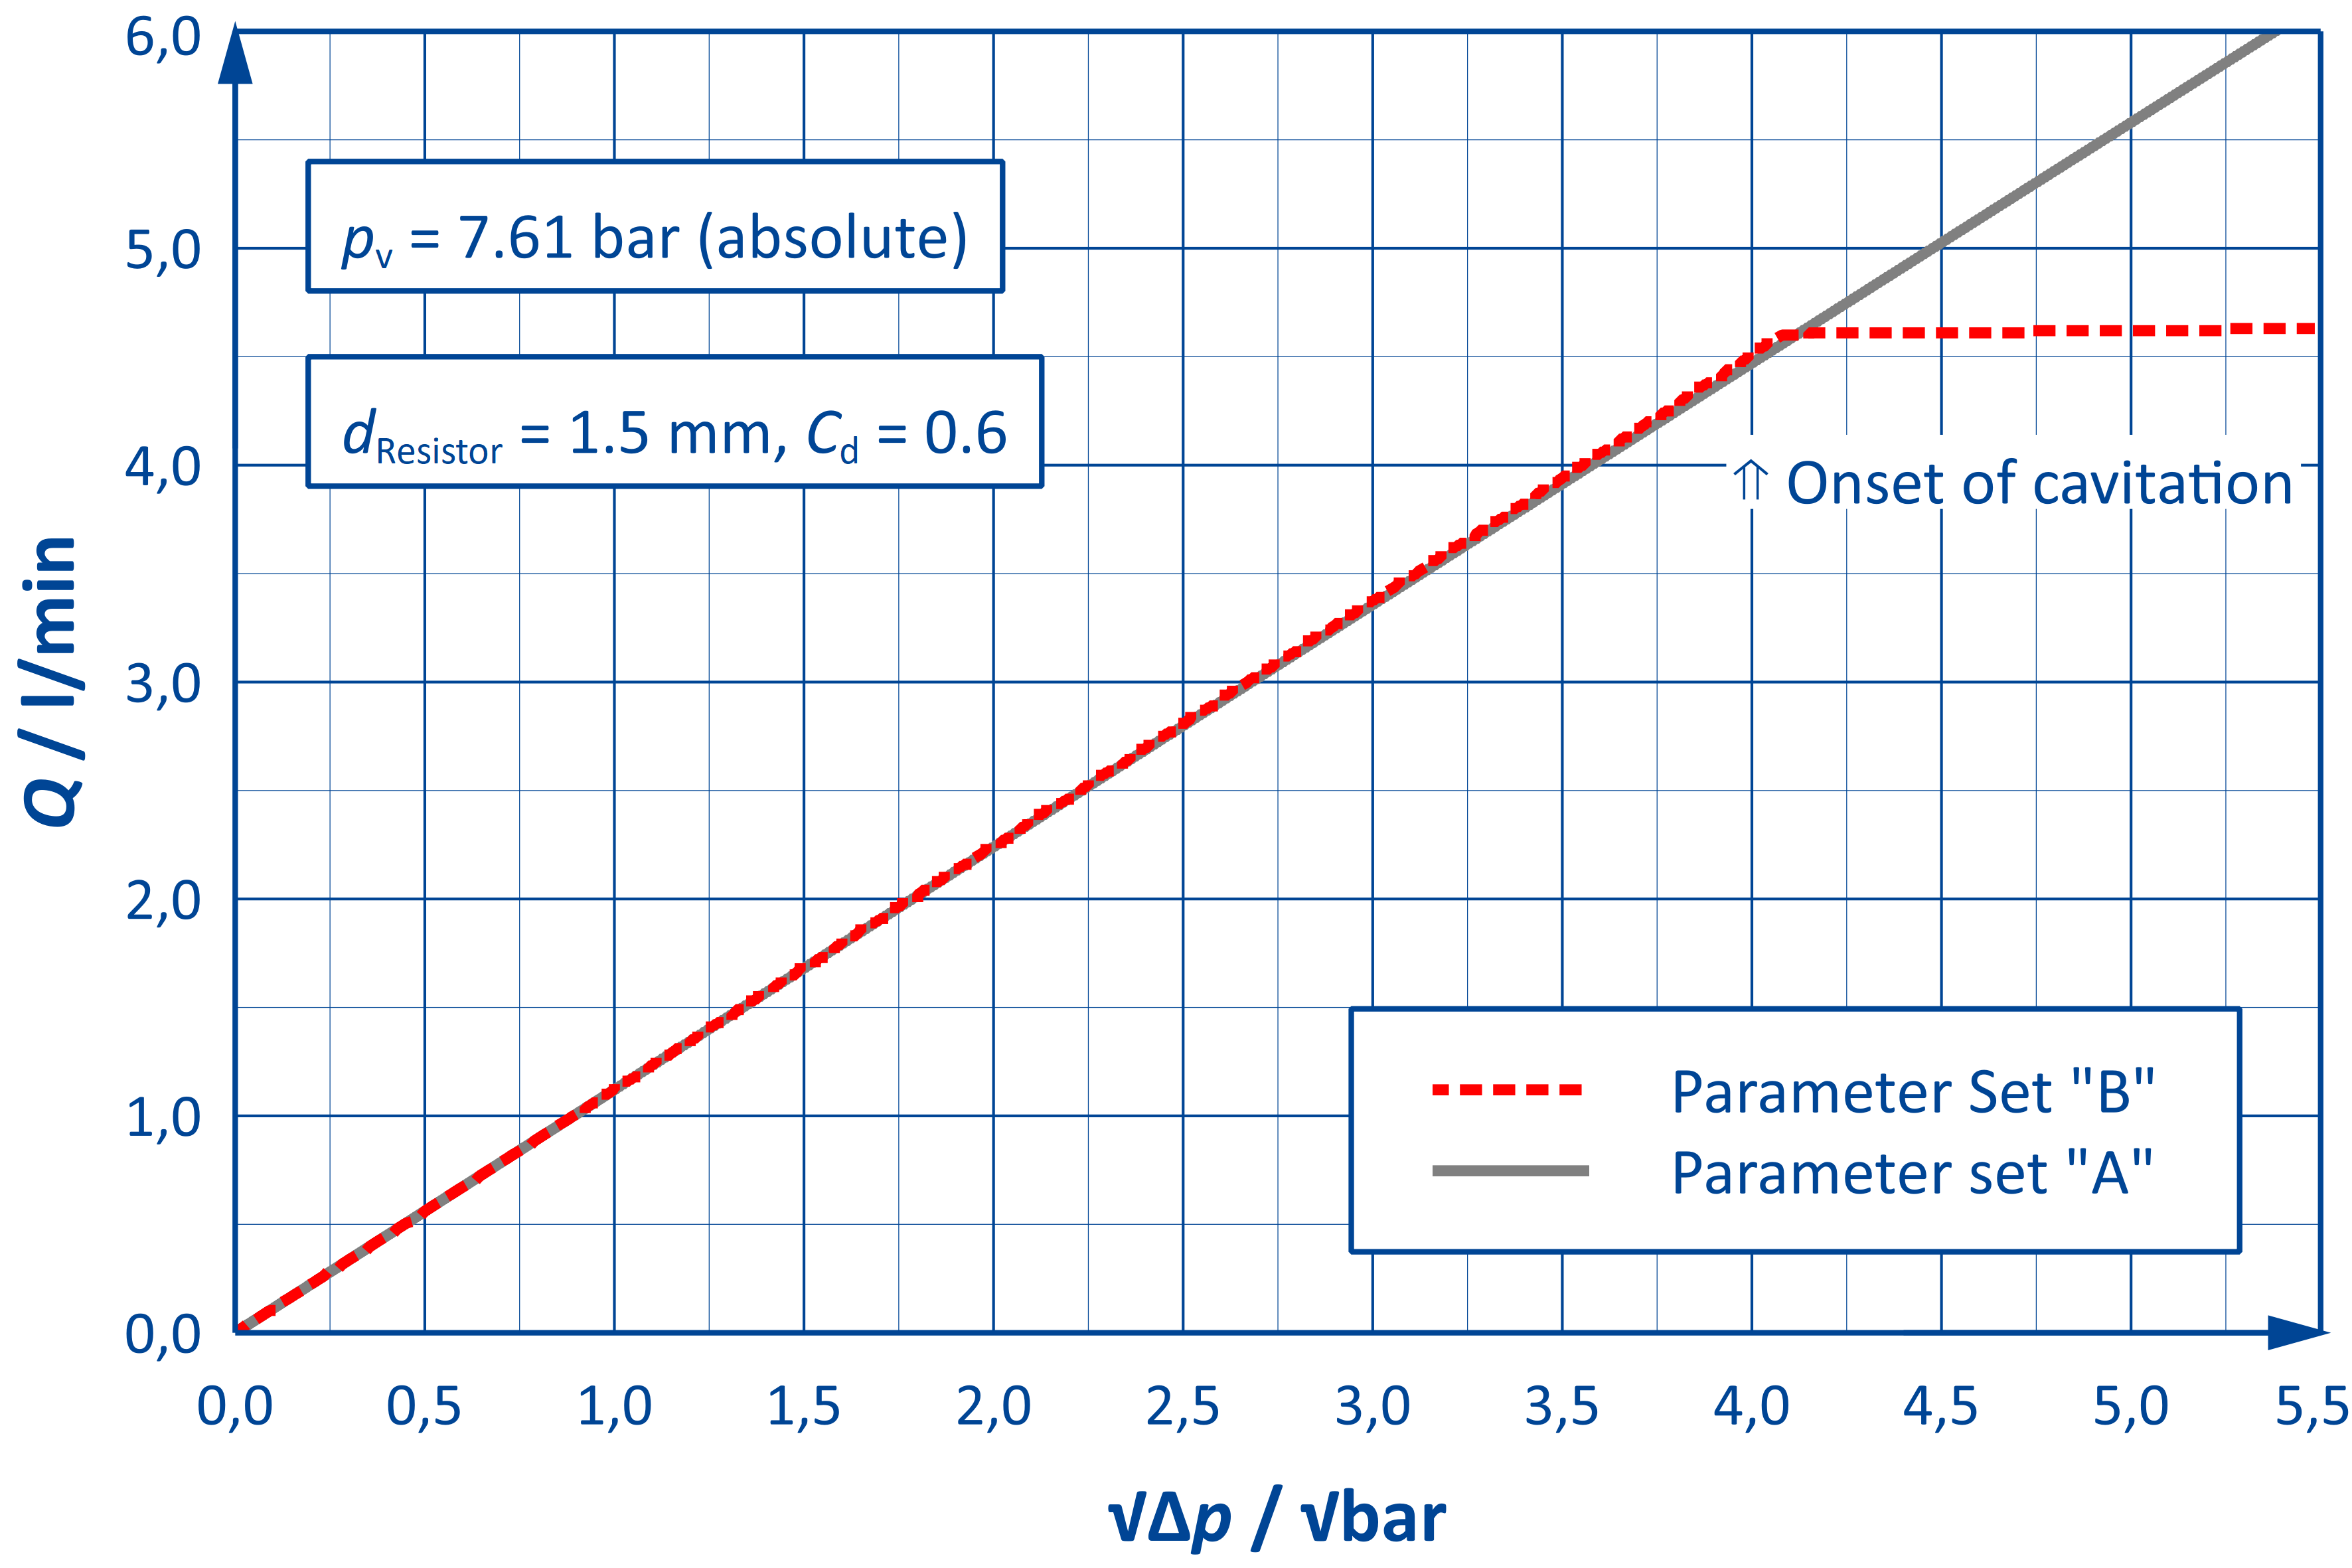
The simulation results are analysed further by plotting the flow rate Q as a function of the root of the pressure difference Δp.
For parameter set "A", the flow rate increases with every increase of the pressure drop (grey curve in the adjacent figure). Because the flow rate is plotted against the root of the pressure drop, the dependency appears linear.
With the parameter sets "B" and "B modified", the flow rate initially follows the same law. At higher pressure losses (and lower pressures in the "vena contracta"), cavitation occurs and thus a flow limitation - "choking" - can be observed (dashed red curve).
The pressure drop is the same in both situations!
The resistor behaves differently for both parameter sets since the pressures in parameter set "A" are further away from the vapour pressure pv!